psst-rs is a small secret-sharing service written in Rust.
The security model is intentionally simple: the secret is encrypted in the browser, the server only stores the ciphertext and nonce, and the decryption key stays in the URL fragment.
Rust was part of the design choice. I wanted a small service that could run as a single binary, with low memory usage and as little operational overhead as possible.
That led to a more practical question: how small can the infrastructure be while still giving me enough visibility to understand what is happening when the service is running?
Designing for small infrastructure 🔗
For psst-rs, minimalism was not only an implementation detail. It was part of the architecture.
I wanted the software and the infrastructure to be designed together. The application is a single Rust binary. The host runs Alpine Linux. The VM is deliberately small.
The service runs on a Scaleway STARDUST1-S instance: 1 shared vCPU, 1 GB of RAM, and a 100 Mbps network interface. With a small disk and no public IPv4 address, the monthly infrastructure cost stays below 1€.
What I find interesting is how relative “small” is.
A machine with 1 GB of RAM sounds tiny by today’s cloud standards. But for a small service written with resource usage in mind, that is still a lot of memory. We often treat this kind of machine as too small before looking at what the workload actually needs.
Of course, the comparison has limits. Modern systems do more, security expectations are higher, TLS is everywhere, monitoring matters, and the software supply chain is heavier.
But it is still a useful reminder.
If the application is small enough, a tiny VM does not have to be a constraint immediately. It can be a design target.
After deploying psst-rs, the Rust process used very little memory, and the VM still had most of its RAM and CPU available. That remaining headroom is not just wasted capacity. It gives the service a safety margin, and it leaves room for the observability layer: Node Exporter, Caddy metrics, and Grafana Alloy.
The observability budget 🔗
For this project, minimalism did not mean running only the application and hoping for the best.
Without observability, the service would just be a black box. It could be cheap, small, and elegant on paper, but I would not know whether it was healthy, under pressure, or failing in boring ways.
So I treated observability as part of the resource budget from the start.
On a VM this small, that matters because the Rust application itself is not the main resource cost center. The observability stack is: Node Exporter, Caddy metrics, Grafana Alloy, and the application metrics endpoint all take part of the available CPU and memory.
If something consumes resources on a VM this small, I want to know why it is there. In this case, the answer is simple: without it, I would be operating blind.
Three Prometheus endpoints 🔗
The setup uses three Prometheus endpoints.
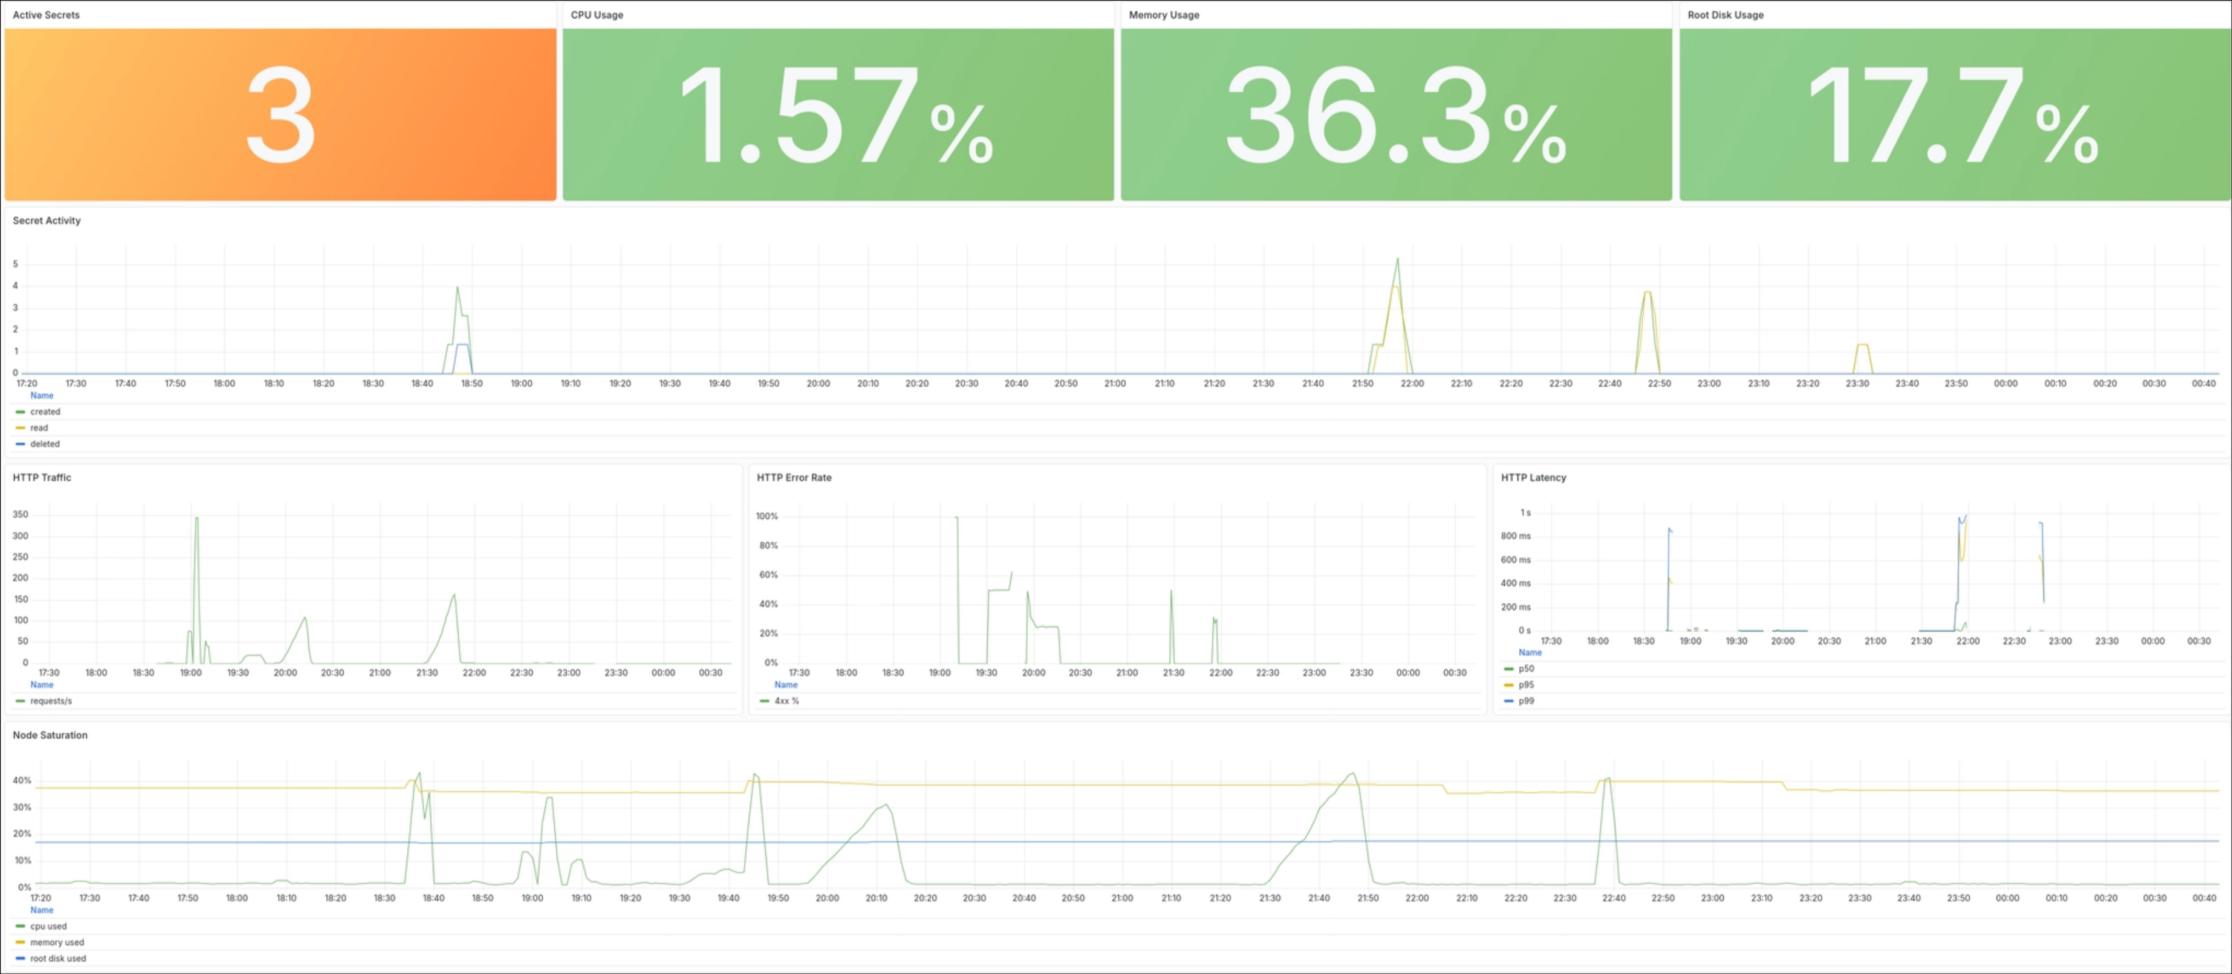
The first one is the node exporter. It gives host-level metrics such as CPU usage, memory usage, disk usage and general VM health. This answers the basic saturation question: is the tiny machine still comfortable, or is it starting to become the bottleneck?
The second one is Caddy. Since Caddy is the reverse proxy in front of the Rust application, it provides the HTTP view of the service: traffic, status codes, errors and proxy-level behavior. This is useful because some of the most interesting signals are at the edge.
The third one is the application itself. psst-rs exposes Prometheus metrics for the domain-specific parts of the service: created secrets, read secrets, expired secrets, deleted secrets, active secrets, etc.
Infrastructure metrics tell me whether the VM has enough room. HTTP metrics tell me how traffic reaches the service. Application metrics show me how the service is actually being used.
Shipping metrics without hosting the platform 🔗
I use Grafana Alloy to collect the metrics and send them to Grafana Cloud on the free tier.
The compromise is deliberate. An alternative would have been to host the monitoring stack myself, probably on a separate machine reachable over Tailscale. That would keep everything under my control, but it would also add another VM to provision, secure, monitor and maintain.
By using Grafana Cloud, the local setup stays small. The VM only runs the service, the reverse proxy, the exporters and the collector. The dashboard and long-term metric storage live outside the machine.
The cost of that simplicity is dependency: if Grafana Cloud is unavailable, I lose dashboards and historical visibility. But the service itself keeps running. For a small side project, that is acceptable.
Golden signals, adapted to a small service 🔗
I used the SRE golden signals as a simple way to structure the dashboard: traffic, errors, latency and saturation.
For psst-rs, traffic means HTTP requests at the proxy and application-level activity such as secret creation and reads. Errors mean failed HTTP responses, database errors, anti-abuse failures, rate-limited requests and invalid payloads. Latency is the response time of the service. Saturation is mostly CPU, memory and disk usage.
The dashboard is meant to answer a few operational questions quickly: Is the VM still comfortable? Is the reverse proxy seeing unexpected errors? Is the application rejecting more requests than usual? Are secrets being consumed and expired normally? Is storage usage still within the expected range?
The cost profile 🔗
The cost side is almost funny.
The service runs on the smallest Scaleway VM I could use, with 1 GB of RAM, shared vCPU and a 10 GB disk. I also avoided a public IPv4 address and run it IPv6-only, with Cloudflare proxying web traffic to the VM.
The monthly infrastructure cost is less than 1€.
Most of that number comes from the provider choice. Scaleway offers a very cheap instance type, and not using a public IPv4 address keeps the bill even lower.
The architecture makes that option usable: a heavier application or a heavier operational model would quickly make this VM unrealistic. In this case, the Rust binary, Alpine Linux, Caddy, SQLite, Grafana Alloy and Grafana Cloud free tier keep the deployment small enough that the cheap VM is still a practical target.
Trade-offs 🔗
This setup is obviously not meant for every workload. It is not highly available, not multi-region, and not designed around an enterprise SLA.
For psst-rs, that is an acceptable trade-off. The service is small, ephemeral, and intentionally narrow in scope. The infrastructure reflects that.